유럽인 자료로 산출된 조현병 다유전자 위험도 점수의 한국인 조현병 환자를 대상으로 한 적용
Comparison of Polygenic Risk for Schizophrenia between European and Korean Populations
Article information

Trans Abstract
Objectives
This study aimed to explore whether common genetic variants that confer the risk of schizophrenia have similar effects between Korean and European ancestries using the polygenic risk score (PRS) analysis.
Methods
Study subjects included 713 Korean patients with schizophrenia and 497 healthy controls. The Korea Biobank array was used for genotyping. Summary statistics of the most recent genome-wide association study (GWAS) of the European population were used as baseline data to calculate PRS. Logistic regression was conducted to determine the association between calculated PRS of European patients with schizophrenia and clinical diagnosis of schizophrenia in the Korean population.
Results
Schizophrenia PRS was significantly higher in patients with schizophrenia than in healthy controls. The PRS at the pvalue threshold of 0.5 best explained the variance of schizophrenia (R2=0.028, p=4.4×10⁻⁶). The association was significant after adjusting for age and sex (odds ratio=1.34, 95% confidence interval=1.19-1.51, p=1.1×10⁻⁶). The pattern of the association remained similar across different p-value thresholds (0.01-1).
Conclusion
Schizophrenia PRS calculated using the European GWAS data showed a significant association with the clinical diagnosis of schizophrenia in the Korean population. Results suggest overlapping genetic risk variants between the two populations.
서 론
조현병(schizophrenia)은 전 세계적으로 1% 정도의 유병율을 보이는 정신 질환이다[1]. 조현병의 발병 요인은 아직까지 명확하지 않으나, 발병에 유전 인자가 중요한 역할을 하는 것으로 알려져 있다. 가족 연구, 쌍생아 연구, 입양아 연구 등에 의하면 약 80%의 높은 유전율(heritability)을 보이나, 다양한 연구에도 불구하고 조현병의 소인 유전자는 아직까지 밝혀지지 못하고 있다[2]. 즉, 조현병은 발병에 다양한 생물학적 인자들이 상호작용하는 복합 유전 다인자 질환(complex genetic disorder)이다[3-6].
조현병에 대한 초기 유전학적 접근에서 연관연구(linkage analysis), 그리고 후보유전자(candidate gene)을 찾기 위한 연합연구(association study)가 진행되었지만 충분히 강력한 유전적 근거는 제시되지 못하였다[3,7,8]. 이에 소인 유전자 탐색의 범위가 단일염기다형성(single nucleotide polymorphism, SNP)을 표지자(marker)로 한 전체 유전체로 확장되었다. 이를 위해 대규모 대상군 모집의 필요성에 따라 정신 질환에 대한 광범위 유전체 연합연구(genome-wide association study, GWAS) 연합체(consortium)가 만들어졌다. 이러한 국제적 협력이 이루어짐에 따라 조현병에 대해 다양한 크기의 유전적 효과(effect size)를 가지고 있는 유전자좌(loci)가 놀라운 속도로 많이 발견되고, 초기에 이루어진 연구 결과를 바탕으로는 3%에 불과했던 유전적 설명력이[9], 최근까지 축적된 연구 결과를 바탕으로 같은 집단에 동일한 검정을 시행하였을 때 약 20%로 높게 보고되었다[10]. 그럼에도 불구하고 여전히 역학 연구를 통해 나타나는 높은 유전율을 모두 규명하지 못하는 상황에서, 흔한 변이(common variant) 뿐만 아니라 어느 수준의 희귀 변이(rare variant)를 포함하는 통합적 탐색의 필요성이 제시되기도 하였다[11].
즉 20세기 초반, 인간 표현형에 대한 다유전자(polygenic) 개념이 논의되기 시작된 이후 GWAS에서는 복잡한 형질에 대해 작은 효과를 가지는 수많은 변이들이 축적되어 표현형으로 나타난다는 근거들을 밝혀왔다. 조현병 영역에서 가장 큰 유전체 연합연구인 Schizophrenia Psychiatric GWAS Consortium에서는 지난 10년 동안 유럽인 인구를 대상으로 다양한 효과 크기를 가지는 145개의 유전자좌 변이를 찾아냈고, 그럼에도 존재하는 실종된 유전율(missing heritability)을 설명하기 위해 동아시아 인구를 추가적으로 포함한 연구에서 총 176개의 조현병 관련 유전자좌를 보고하였다[12-14].
보다 정교해지는 GWAS 자료를 바탕으로 하여 최근 특정 표현형(phenotype)에 대한 유전적 예측 인자를 계산하는 다유전자 위험점수(polygenic risk score, 이하 PRS) 개념이 소개된 이후[15], 복합유전질환에서 질환간, 표현형간, 민족간 소인유전자 구성의 차이를 비교하는 다양한 시도들이 이루어지고 있다[16]. PRS는 GWAS에서 밝혀진 단일 표현형에 대한 여러 SNP의 위험도를 종합 점수로 산출하는 지수이다. 정신 질환에서는 International Schizophrenia Consortium (2009)에서 처음으로 GWAS 결과에서 산출된 조현병 PRS를 사용하여 양극성장애를 예측하는 회귀 모형을 구성하였다[9]. 이 연구는 조현병과 양극성장애 사이에 유전적으로 공유되는 부분이 많을 것이라는 임상적 인상에 대한 객관적 근거를 제시하기 위한 유전체 연구 방법으로서 시도된 것이었다[9]. 이후 PRS를 이용하여 조현병에 대한 종합적인 유전적 소인을 보다 정교하게 설명하기 위한 시도들이 지속되어 왔다[9,10,17].
그동안 대부분의 조현병 GWAS는 유럽인을 대상으로 이루어져 왔는데[18,19], 최근 아시아계 및 다양한 민족에서의 조현병 GWAS 결과가 나오고 있어서 한 집단에서 산출된 PRS를 다른 인구 집단에 적용하여 민족 간의 유전적 구조 차이를 평가해 볼 수 있게 되었다[14,20,21]. 조현병의 경우, 민족 특이적인 유전자 변이도 발견되고 있지만[12,13], 최근 유럽과 아시아인을 대상으로 한 분석을 통해 볼 때, 상당 부분은 민족 간에 공유되는 것으로 보인다(genetic correlation, rg=0.98±0.03) [20,22]. 그러나 서로 다른 인구 집단에서 PRS 분석을 상호 적용하기 위해서는 민족 간에 서로 다른 연관 불균형(linkage disequilibrium) 패턴에 대한 비교 유전학(comparative genetic)적 이해가 선행되어야 할 것이다[22].
본 연구에서는 유럽인 GWAS 결과를 한국인 조현병 환자에 적용하여 산출한 조현병 PRS가 유럽인 조현병 환자에 적용한 조현병 PRS와 비교해 유사한 수준의 연관을 보이는지 파악하고자 하였다. 이는 유럽인과 한국인에서 공통으로 작용하는 조현병의 유전적 소인을 파악하는 과정의 첫걸음이 될 것이다.
방 법
연구 대상
연구 대상은 삼성서울병원에서 모집된 Diagnostic and Statistical Manual of Mental Disorders-IV-TR (DSM-IV-TR)23)의 기준에 근거한 조현병 환자군 713명과 정상 대조군 497명이 포함되었다. 본 연구는 각 기관의 윤리위원회(Institutional Review Board)에서 승인을 받았고, 모든 참여자에게 연구에 대한 충분한 설명을 제공하고 서면 동의서를 취득하였다.
유전체 분석
대상군의 말초혈액으로부터 WizardTM Genomic DNA Purification kit (Promega, Madison, USA)을 사용하여 genomic DNA를 추출하였다. 유전체 분석을 위해 Affymetrix AxiomⓇ Korea Biobank Array 1.0 (K-CHIP)(Affymetric, Santa Clara, USA) [24]을 사용하였으며, 약 833,000개 SNP의 유전자형을 분석하였다.
Genomic DNA 200 ng을 중합효소연쇄반응(Polymerase Chain Reaction, PCR)을 통해 증폭시키고 제한효소에 의해 125 bp 길이로 단편산물을 형성한 후 각 SNP별 표지자와의 결합 과정을 거쳐 최종산물로 얻었다. 이후 GeneTitan MC Instrument (Affymetrix, Santa Clara, USA)와 Axiom KORV1.0 96-array plate (Affymetrix, Santa Clara, USA)를 이용하여 혼성화(hybridization), 세척(wash) 및 스캔(scan)을 시행하였으며, 스캔 결과로부터 Genotyping ConsoleTM Software (Affymetrix, Santa Clara, USA)를 사용하여 CEL 형태의 데이터를 산출하고 유전자형 데이터를 결정하였다.
질 관리(Quality Control)와 유전자형 결측치 대치(imputation)
유전자형 데이터의 질 관리를 변이 및 샘플 수준에서 진행하였다. 결측률 5%를 초과하고, 샘플 간에 친인척 관계를 갖거나 임상 정보와 칩데이터상 성별 정보 간에 불일치하는 샘플 및 이형접합률(heterozygosity rate)에 위배되는 샘플을 제거하였으며, 주성분 분석(Principal Component Analysis, PCA)을 시행하여 전체적으로 균질성에 벗어나는 샘플이 없음을 확인하였다. 또 결측률 1%를 초과하고, Hardy-Weinberg 평형에 위배되며(p<10-6), 소수 형질 빈도(minor allele frequency)가 1% 미만인 변이를 제거하였다.
유전자형 결측치를 대치하기 위한 레퍼런스로는 Haplotype Reference Consortium의 레퍼런스 패널을 이용하였다. Eagle v2.4을 사용하여 데이터로부터 일배체형(haplotype)을 추정한 후(phasing), Minimac4 프로그램을 이용해 유전자형 결측치를 대치하였다(imputation). 유전자형 결측치 대치 후, 신뢰도가 높은 변이를 확보하기 위해 R2 0.8 미만과 소수형질 빈도 1% 미만의 변이를 제거하였고, 그 결과 최종적으로 713명의 조현병 환자군과 497명의 정상대조군 및 5,483,856개 변이가 질 관리를 통과하였다.
다유전자 위험점수(PRS) 산출
PRS는 일반적으로 사용되고 있는 가중치(weighted) PRS 방법으로 계산되었다. 이것은 레퍼런스 자료로 선정한 대규모 GWAS에서 추정된 특정 형질과 관련된 유전자 형질의 유전적 효과를 회귀 계수 값으로 하여 가중치를 주는 PRS 계산 방법이다. 각 개인이 가지고 있는 SNP의 위험 형질(risk allele)의 수(0, 1, 2)를 전체 집단에 대해 가산적(additive) 모형을 가정하여 유전적 형질의 증가 당 회귀 계수 값을 구한 후 위험 형질의 수, 즉, 0, 1, 2에 가중치로서 회기 계수를 곱한 후 더하는 방식이다. 이렇게 계산된 PRS 값에 대해 PRS의 평균을 제하고 PRS의 표준편차로 나눈 값을 표준화된 PRS로 최종적으로 사용하였다.
S: GWAS 결과에서 해당 변이에 대한 로그 교차비[log (odds ratio)]
G: 해당 변이에서 효과 대립유전자(effective allele)의 개수(0, 1, 2 중 하나)
PRS 산출을 위해서는 레퍼런스 자료를 선택해야 하는데, 본 연구에서는 Psychiatric Genomic Consortium (PGC, http://www.med.unc.edu/pgc)에서 받을 수 있는 유럽계 후손 집단의 조현병 GWAS 요약 통계자료(summary statistics)를 사용하였다. 레퍼런스 자료로 선정한 유럽인 조현병 GWAS의 유전체 분석, 질 관리, 임퓨테이션과 대상 샘플 구성 등 자세한 정보에 대해서는 Lam 등[22]에서 상세히 설명하고 있으며, 유럽계 조현병 33,640명과 정상 대조군 43,456명으로 구성되었다. PRS 산출에 활용한 SNP 선정은 GWAS 결과의 유의수준(p-value)에 대한 경계값을 5e-08, 1e-06, 0.0001, 0.001, 0.01, 0.05, 0.1, 0.2, 0.5, 1의 10가지로 설정하여 선정한 뒤 유전체 연관 불균형을 확인하여 최종 선정하였다. 연관 불균형 값 산출에는 본 연구진이 가진 조현병, 양극성장애, 정상군을 합친 1,987명의 유전체 자료로부터 계산된 값을 이용하였다. PRS 계산에는 PRSice-2 프로그램을 이용하였다[25].
통계 분석
환자군과 정상 대조군의 인구학적 변인 차이를 알아보기 위해 Student t-검정과 카이제곱검정(chi-square test)을 사용하였다. 또한 환자군과 정상 대조군 사이의 PRS를 t-검정으로 비교하였다. 최종적으로 로그 회귀 분석(logistic regression analysis)을 이용하여 조현병 유무와 PRS간의 연관성을 평가하였다. 진단을 종속 변인, 위에서 산출된 PRS를 독립변인으로 포함하였고 나이와 성별을 공변량으로 포함하였다. Wald 검정을 통해 유의 수준을, Nagelkerke의 R2를 통해 그 설명력을 평가하였다.
결 과
조현병 환자 713명의 평균연령은 34세였고 남자가 51.5%였다. 정상 대조군 497명의 평균연령은 32세였고 남자가 44.9%였다. 환자군과 정상 대조군에서 나이와(t=-4.64, p<0.001) 성별(χ2=5.11, p=0.024) 분포는 두 군간 유의미한 차이를 보였다.
환자군과 정상 대조군 PRS 밀도 분포(density plot)는 그림 1과 같이 두 군 모두에서 정규 분포를 따랐다. 두 군간에 PRS는 유의미한 차이가 나타났다(t=-4.82, p=1.7×10⁻⁶).

Distribution of polygenic risk score for schizophrenia generated from genome-wide association study of European population in Korean patients with schizophrenia and healthy controls. Polygenic risk score plots for patients with schizophrenia (n=713, red line) and controls (n=497, blue line). The x-axis illustrates the polygenic risk score and the y-axis illustrates density, showing the distribution of the weighted PRS.
나이, 성별을 보정한 로지스틱 회귀 분석에서, 분석에 포함될 SNP의 유의수준의 경계값을 0.5로 설정하였을 때 가장 유의한 결과가 나타났다(그림 2B). 유의수준에 대한 경계값 0.5에서 선택된 SNP의 개수는 113,235개였다(표 1). 나이, 성별을 보정한 후, 조현병 PRS는 조현병 진단과 유의미한 연관 관계를 보였다(odds ratio=1.34, 95% confidence interval=1.19~1.51, p=1.1×10⁻⁶). Nagelkerke의 R2 수치는 0.028로 조현병 진단을 구분하는데 있어 2.8%의 설명력을 보였다(p=4.4×10⁻⁶). 유의수준의 경계값이 0.01보다 컸던 모든 경우에 대해서 2% 이상의 설명력과 p=10-6 미만의 유의수준을 보이는 유사한 결과가 관찰되었다(표1, 그림 2).
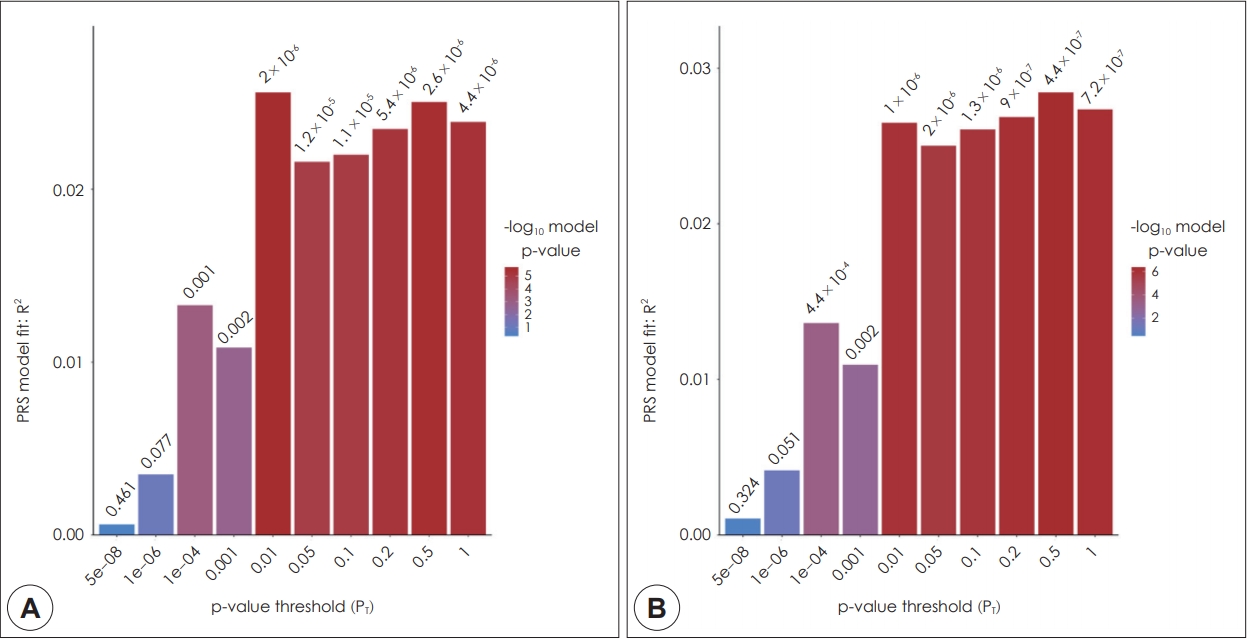
Polygenic risk score for schizophrenia generated from genome-wide association study of European population in Korean patients with schizophrenia. The x-axis illustrates the p-value threshold used to select SNPs from the discovery genome-wide association study (GWAS). The y-axis illustrates the percentage variance explained on the liability scale. The p-value for the association between polygenic scores and diagnosis of schizophrenia are shown above each bar. A: unadjusted. B: adjusted for sex and age.
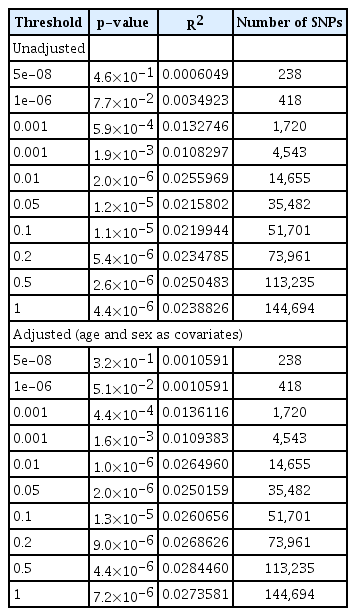
Analysis of association between polygenic risk score of schizophrenia from European population and schizophrenia phenotype of the Korean population
고 찰
본 연구에서는 한국인 조현병 환자 713명과 정상 대조군 497명을 대상으로, 유럽인 대상의 조현병 GWAS 결과로부터 산출된 PRS를 적용하여 다유전자 위험도를 분석하였다. 그 결과, 조현병 환자는 대조군에 비해 유의하게 높은 수준의 PRS를 보였다. 여러 단계의 유의수준을 경계값으로 두고 분석한 결과, GWAS p값 0.5 이하에서 2.8%로 가장 높은 설명력을 보였다(p=4.4×10⁻⁶). 유럽인 자료를 기반으로 산출된 한국인 조현병 PRS가 환자-대조군을 통계적으로 유의미하게 구분할 수 있었지만, 유전적 설명력 값은 조현병 GWAS연구 결과를 레퍼런스로 동일한 인종의 평가 집단에서 산출된 조현병 PRS의 유전적 설명력에 미치지는 못한다는 것을 의미한다[10]. 본 연구에서의 낮은 설명력은 비교적 적은 사례 수와 더불어 질병에 대한 유전적 소인이 민족 간에 실제로 다를 수 있다는 점, 그리고, 유전자 부위별로 GWAS의 검증력에 있어서의 민족 간 차이가 있다는 점 등에서 비롯된 것으로 볼 수 있다.
PRS를 산출하기 위해서는 레퍼런스 자료가 정의되어야 하는데, 지금까지 대부분의 대규모 유전 연구들은 서양인을 대상으로 이루어져 왔다. 최근에는 다른 인종 혹은 다인종 혼합 인구집단(admixed population)에 서양인 GWAS 결과 자료를 적용하여 산출한 PRS를 검증하는 연구가 이루어지고 있다[20,22,26,27]. 최근 한 연구에서는 PGC 서양인 GWAS 결과를 레퍼런스로 브라질 다인종 혼합 인구집단 조현병 환자의 PRS를 분석하였을 때, 설명력이 혼합 인구집단에서는 6.8%, 백인(Caucasian)만으로 제한한 인구집단에서는 9.2%으로 달라지는 것을 보여주었다[28].
조현병 진단 뿐 아니라, 조현병에서 관찰되는 다양한 임상 특성들을 표현형으로 하는 PRS 연구도 이루어지고 있다. 조현병 환자들 중에도 높은 조현병 PRS를 가진 환자가 음성 증상이 더 심하고 예후가 더 좋지 않으며, 인지 기능 저하가 너 심각하다는 보고도 있으며, 항정신병약물에 대한 반응이 나쁘다는 결과가 보고되었다[29-31]. 또한 임상적 고위험군에서 정신증 발병을 예측하는 도구로 정신증 PRS를 적용한 연구도 있다[32,33]. 다른 인종의 GWAS 결과를 이용한 PRS 연구 방법론이 지속적으로 개선되고 있어, 추후 한국인 조현병 환자에서도 다양한 임상 특성들을 표현형으로 한 연구들이 요망된다.
본 연구의 제한점은 다음과 같다. 첫째, 적은 사례 수로 인해 설명력의 저하가 초래되었을 수 있다. 둘째, 레퍼런스로 사용된 서양인 집단과 한국인의 기본적인 유전적 구조의 차이를 검증하는 선행 분석이 진행되지 못했다. 마지막으로, 본 연구에서 레퍼런스 자료로 사용할 만한 한국인 조현병의 GWAS 자료가 없었고, 중국과 일본에서 발표한 아시아인 GWAS 자료를 적용하지 못하였다.
향후 우리나라의 추가적인 GWAS 자료 및 아시아 자료를 통한 PRS 분석이 진행되어야 할 것이며, 그 외 다양한 인종 집단의 데이터 분석을 통해 인종 간의 조현병 유전적 소인의 공통점과 차이점을 파악할 수 있을 것이다. PRS는 정상인에서 개인의 질병 위험도를 예측 도구로 사용될 수 있을 뿐 아니라, 여러 질환 간의 유전적 배경의 상관성을 파악하는 데에 이용될 수 있다[34-37]. 또한, 특정 질환의 PRS와 인지기능이나 뇌영상 소견 등 내적표현형과의 연관성, 치료 반응 및 예후 예측 도구로의 적용 가능성 등에 관한 연구도 점차 활발해지고 있다[29,36-40].
결 론
본 연구에서는 유럽인 조현병 GWAS 결과에서 산출된 PRS를 한국인 조현병 환자와 정상 대조군에 적용, 유럽인 PRS와 한국인 조현병 간의 연관성을 분석하였다. 그 결과, 유럽인 PRS는 한국인에서 2.8% 설명력을 가지는 분산을 보였으며, 이는 유의한 수준의 조현병 위험도 예측력으로 평가되었다. 본 연구 결과는 대규모 자료 분석에서 보다 예측력이 낮은 수준이지만, 유럽인과 한국인에서 공통으로 작용하는 조현병의 유전적 소인을 파악하는 첫걸음이 될 것이다.